
Data Analytics Technologies: A Primer and Provider Selection Guide
Contents
1. Purpose of White Paper and Executive Summary
2. Data Analytics
2.1. Definition
2.2. Types of Data Analytics
3. Types of Data Analytic Services and Sources of Information
3.1. Application Area
3.2. Sources of Data/Information
3.3. Core Services and Consulting Offered by Data Analytics Providers
4. Enabling Technologies
4.1. Interoperability and Health Information Exchange Platforms
4.2. Structured and Unstructured Data
4.3. Relevant Standards and Vocabularies
4.4. Health Information Exchange Intermediaries
4.5. Data/Information Repositories
4.6. APIs
5. Potential Uses and Benefits of Data Analytics Technologies
5.1. Improved Health Outcomes
5.2. Mitigate Risk
5.3. Optimize Reimbursement
5.4. Reduce Hospitalizations
5.5. Benchmarking/Referrals
5.6. Enhance Efficiencies
5.7. Improved Financial Health
5.8. Improved Patient/ Resident/ Client Experience
5.9. Improved Clinician/ Caregiver/ Staff Satisfaction (Physician/ Nurse)
5.10. Enhanced Business Acumen and Strategic Positioning
6. Potential LTPAC Provider Business Models
6.1. Value-Based Care
6.2. Standard of Business
6.3. Return on Investment (ROI) of Data Analytics Technologies
6.4. ROI to Care Provider
7. Planning for and Selecting Appropriate Data Analytic Technology
7.1. Planning for Data Analytics Solutions
7.2. Visioning and Strategic Planning
7.3. Organizational Readiness Assessment
7.4. Operational Planning
8. Data Analytics Matrix Components
9. Contributors
9.1. Contributing Writers
9.2. Workgroup Members
9.3. Participating Vendors
10. References
1. Purpose of White Paper and Executive Summary
1.1. Purpose
The purpose of this paper is to help LeadingAge and CAST members and other aging services organizations understand the range of data analytics technologies available in the marketplace, the technologies’ uses, and their benefits. In addition, the white paper will help providers plan for, select, and implement such a solution. The paper will also include a matrix of existing Data Analytics solutions that will help providers select solutions that best fit their requirements.
1.2. Executive Summary
The LeadingAge CAST Data Analytics White Paper is intended to help LeadingAge CAST members and other aging services organizations understand the range of data analytics technologies available in the marketplace, the technologies’ uses, and their benefits.
The term data analytics refers to the process of examining datasets to draw conclusions about the information they contain. Data analytic techniques enable an organization to take raw data and uncover patterns to extract valuable insights from it.
This white paper will help providers plan for, select, and implement a data analytics solution.
The white paper will help providers plan for, select, and implement such a solution. The full LeadingAge CAST Data Analytics Online Selection Tool will include a matrix of existing data analytics solutions that will help providers select solutions that best fit their requirements.
Potential Uses and Benefits of Data Analytics Technologies
The white paper outlines and expounds upon the following ways that organizations can use and benefit from data analytics technologies:
- Improve Health Outcomes: By digitizing, combining, and effectively using big data, healthcare organizations of all sizes can detect diseases at earlier stages, manage specific individual and population health, and detect health care fraud more quickly and efficiently.
- Mitigate Risk: Data analytics can help an organization understand risks and take preventive measures.
- Optimize Reimbursement: Data analytics can pinpoint flaws in claim submittal that may lead to denials or delays.
- Reduce Hospitalizations: Organizations can use data and analytics to assess patients and help determine who needs to be admitted for observation and who can be sent home safely.
- Benchmarking/Referrals: Data analytics outlines the ways communities stack up against others in today’s competitive marketplace. Organizations then can quickly and accurately identify strengths and opportunities for change, as well as target marketing, scaling efforts, and referral opportunities.
- Enhance Operational Efficiencies: Gathering and analyzing data about the supply chain can show where production delays or bottlenecks originate and help predict where future problems may arise.
- Improve Financial Health: Consulting firm McKinsey & Company believes that big data could help reduce waste and inefficiency in clinical operations, research and development, and public health.
- Improve Patient/Resident/Client Experience: By using data analytics to create comprehensive customer profiles drawn from physical retail, e-commerce, social media, and similar data, businesses can gain insights into customer behavior to provide a more personalized experience.
- Improve Clinician/Caregiver/Staff Satisfaction: To really become transformational and succeed in the value-based care environment, hospitals and senior living need to understand their patients’ needs by looking at data.
For all the reasons listed above, data analytics enhances an organization’s business acumen and strategic positioning. Without the data and insight from the data, it will be difficult to achieve these benefits.
This comprehensive white paper shares types of data analytics, plus definitions and examples of many aspects of data analytics.
Data Analytics Information Provided
This comprehensive white paper shares types of data analytics, plus definitions and examples of many aspects of data analytics. It shares the types of data analytic services and information sources that touch multiple areas of senior living providers’ businesses: financial, clinical, population health, referrals, human resources, value-based care, risk management, and business.
The white paper also outlines numerous sources of data information, including the following: electronic health records (EHRs), financial system data, referral systems, telehealth and remote patient monitoring technologies, medication management technologies, functional assessment and activity monitoring technologies, wellness systems, HR systems, laboratory data, marketing data, customer relationship management data, engagement data, public health data, health information exchange/health registry data, regulatory assessments, public reporting, patient-generated health data, social determinants of health, and claims data.
The white paper outlines numerous sources of data, information, and technologies that enable data analytics.
To help organizations best integrate data analytics, the white paper discusses the kinds of services and consulting assistance that data analytics providers offer, including data management and engineering and core data analytic services.
The white paper guides aging services providers in understanding technologies that enable data analytics. These technologies include interoperability and health information exchange platforms, structured and unstructured data, relevant standards and vocabularies, health information exchange intermediaries, data/information repositories, and APIs.
Data Analytics and Strategic Planning
This paper discusses data analytics as it relates to potential long-term and post-acute care (LTPAC) provider business models such as value-based care, standard of business, return on investment (ROI) of data analytics technologies, and ROI to care provider.
This paper discusses data analytics as it relates to potential long-term and post-acute care (LTPAC) provider business models.
It concludes with advice on how best to plan for and select appropriate data analytic technology. Guidance on visioning and strategic planning, determining organizational readiness, and operational planning are included.
The white paper also outlines the 14 sections of the Data Analytics Selection Matrix that helps organizations narrow the possible products. The matrix is part of the LeadingAge CAST Data Analytics Online Selection Tool.
1.3. Disclaimers
This information is meant to assist in understanding data analytics technologies, but it cannot possibly include all systems that may be available. Products mentioned in this report are only illustrative examples and have not been tested or independently evaluated or endorsed by LeadingAge or LeadingAge CAST. Please use this report as a general guideline to understand functionalities and examples of current data analytics systems. Where appropriate, provider case studies were identified.
2. Data Analytics
2.1. Definition
The term data analytics refers to the process of examining datasets to draw conclusions about the information they contain. Data analytic techniques enable you to take raw data and uncover patterns to extract valuable insights from it 1.
2.2. Types of Data Analytics
2.2.1. Descriptive Analytics
Descriptive analytics are exactly like their sound. They tell you what happened. Let’s say you go to the doctor and the nurse checks your vitals: your weight gain or loss, your height, your blood pressure, your resting heart rate, etc. Descriptive analytics are essentially your vitals—the simplest form of data analytics.
For a business, these are the analytics that are essential to reporting. They are designed to give you the very basics of who, what, where, when, how, and how many. They provide you with key metrics about your business and serve as a basis with which to dive deeper. You will find these kinds of analytics in any business intelligence (BI) tool 2.
2.2.2. Diagnostic Analytics
Diagnostic data helps you answer why something happened. It is used to find dependencies, identify patterns, and solve problems. Diagnostic data is built from descriptive data. For example, if you go to the doctor’s office and they uncover a problem, they will run tests to see the root cause of that problem. Diagnostic data works kind of like that, except the tests are run automatically.
Diagnostic data is automatically generated by the various systems you use. Using advanced analytics tools, analysts use this data to drill down, perform data discovery, mine data, and find correlations that will help answer why something happened. It is like your health care team diving down to find the root cause of your health woes.
A well-designed BI dashboard gives you the ability to analyze diagnostic data to uncover problems 3.
Diagnostic data helps you answer why something happened. Predictive analytics help you predict what will happen. Prescriptive analytics prescribe what action to take.
2.2.3. Predictive Analytics
Predictive analytics help you predict what will happen. Using descriptive and diagnostic analytics, predictive analytics find tendencies, clusters, and exceptions in order to predict future trends. Here is where the doctor analogy falls apart a little bit.
If your physician took your vitals, test results, health data from wearables, and other similar baseline data about you and then ran that data through artificial intelligence and machine learning programs, she could very likely predict health outcomes for you. Unfortunately, predictive analytics are not quite there yet in the health care space, but hopefully they will be soon.
An exception is prognosis for certain types of illnesses. For example, a doctor is able to predict survival rates for some cancer types at different stages in response to specific treatments based on population data and studies of those cancers and their treatment. Predictive analytics have the potential to do the same for your business today.
Predictive analytics are powerful forecasting tools. Looking for trends? Planning for the future? Predictive analytics are what you need. They also enable statistical modeling. They require the use of machine learning and artificial intelligence to build predictive models, including ones that continue to evolve and learn from new data and user feedback, and they can be a huge asset to your business 4.
With prescriptive analytics, you are analyzing large sets of descriptive and predictive data to find the best possible outcome.
2.2.4. Prescriptive Analytics
After your physician has taken vitals, run tests, and drilled down to the root of the problem, she/he prescribes a medication or change in diet and lifestyle. Prescriptive analytics work the same way. They prescribe what action to take to eliminate a future problem or make the most of a promising trend.
Prescriptive analytics require artificial intelligence and big data. With prescriptive analytics, you are analyzing large sets of descriptive and predictive data to find the best possible outcome 5. Often prescriptive analytics are referred to as decision-making or decision-support capabilities of data analytics systems.
3. Types of Data Analytic Services and Sources of Information
3.1. Application Area
3.1.1. Financial
In today’s environment of value-based care, it is important to measure an organization’s financial health. The critical role of accounting, including cost accounting, and finance requires technical competencies used in decision support for all areas of health care management. Leaders need to access cross-organizational data that will give them the answers they need to make informed decisions about operations, strategic planning, marketing, quality assurance, and risk management initiatives.
In today’s environment of value-based care, it is important to measure an organization’s financial health.
Sophisticated analytics applications provide value to health care organization’s data in a way that individual source systems cannot. Analytics work with enterprise data warehouses (EDWs) so that all users within an organization gain insights from the multiple data sources. Data sources include resident/client registration-admission, discharge, transfer (R-ADT), resident/client financial services, billing systems, nutrition and food services (N&FS), therapy services (such as rehabilitation, physical therapy, occupational therapy, and respiratory therapy), etc. 6 7
3.1.2. Clinical
Clinical analytics enable the development of clinical pathways and rules for the different conditions and diagnoses encountered. They track vital signs, clinical observations, medications, and service delivery daily. They generate reports automatically and make the data accessible through dynamic dashboards without having to run the static reports periodically. In addition, the clinical rules apply evidence-based and best practices to help support clinicians in making decisions, usually at the patient level 8.
3.1.3. Population Health
The Centers for Disease Control and Prevention (CDC) views population health as an interdisciplinary, customizable approach that allows health departments to connect practice to policy for change to happen locally. This approach utilizes non-traditional partnerships among different sectors of the community—public health, industry, academia, health care, local government entities, etc.—to achieve positive health outcomes. Population health provides “an opportunity for health care systems, agencies and organizations to work together in order to improve the health outcomes of the communities they serve by bringing significant health concerns into focus and addressing ways that resources can be allocated to overcome the problems that drive poor health conditions in the population.”
Population health analytics are being increasingly used as tool for preventive care and overall wellness management. Analytics tools are used for risk stratification, targeted outreach, care plans, performance benchmarking, planning interventions, and leveraging registries for surveillance. 9 10 11
3.1.4. Referral
In health care, the concepts of acquiring new customers (patients and consumers) and maintaining those relationships is as important as in any other industry. However, other health care providers and a referral system are traditionally used to acquire customers. Health care analytics are useful and needed in this situation.
Referral analytics could help prevent unnecessary Emergency Room visits and save time, money, and energy. In the past, hospitals would repeat tests over and over, and even if health care providers could see that a test had been done at another hospital, they would have to go old school and request or send a long fax just to get the information they needed. Patients would be referred to different clinics and treated by multiple case management workers. This situation was bad for the patient and wasted precious resources for the health care organizations involved.
Referral analytics could help prevent unnecessary Emergency Room visits and save time, money, and energy.
Referral analytics build on interoperability and health information exchange capabilities to share patient records between providers, including hospitals, physicians, and ER departments. Referral analytics enable clinicians to know things like the following:
- If the patient they are treating has already had certain tests done at other hospitals and what the test results are.
- If the patient in question already has a case manager at another hospital, preventing unnecessary assignments.
- What advice has already been given to the patient, so that providers can maintain a coherent message to the patient. In addition, referral management applications of data analytics systems usually give you access to quality data about potential referral partners, destinations, or sources in a specific market. This information can help you identify providers with whom you are working, can work, or should be working more closely. For example, you can find partners who have excellent capabilities in managing a certain population that has a high hospital readmission rate when discharged to less-competent communities. 12 13 14
3.1.5. HR
Mick Collins, global vice president of Workforce Analytics & Planning Solution Strategy and chief expert at SAP SuccessFactors, gives this definition of human resources (HR) analytics: “HR analytics is a methodology for creating insights on how investments in human capital assets contribute to the success of four principal outcomes:
- Generating revenue,
- Minimizing expenses,
- Mitigating risks, and
- Executing strategic plans.
This is done by applying statistical methods to integrated HR, talent management, financial, and operational data.” When used strategically, analytics can transform how HR operates, giving the organization insights that actively and meaningfully contribute to the bottom line. 15 16
Quality health care analytics help identify areas of improvement within the organization.
3.1.6. Quality (such as Five-Star Rating)
Health care organizations’ priority is to provide the best patient care they can. Quality health care analytics help identify areas of improvement within the organization. Analytics not only can help to reduce risk factors and treatment side effects, but also can improve processes and procedures over time. Quality health care is a high priority for the U.S. Department of Health and Human Services (HHS) and the Centers for Medicare & Medicaid Services (CMS).
CMS implements quality initiatives to assure quality healthcare for Medicare beneficiaries through accountability and public disclosure. CMS uses quality measures in its various quality initiatives that include quality improvement, pay for reporting, and public reporting.
Quality measures are tools that help us measure or quantify health care processes, outcomes, patient perceptions, and organizational structure. Quality measures also include systems that are associated with the ability to provide high-quality health care and/or that relate to one or more quality goals for health care at the global or population level. These goals include effective, safe, efficient, patient-centered, equitable, and timely care. 17 18
3.1.7. Value-Based Care
As payers, like CMS, and providers begin to switch from fee for service (FFS) models to value-based care (VBC) models, an increased investment in data and analytics systems can maximize value for patients while achieving the best outcomes at a lower cost. Data and analytics systems can explore opportunities to offset any negative financial consequences resulting from the transition from FFS care.
Health care providers who succeed under value-based reimbursement realize the power of an effective data analytics strategy.
Investing in a strong data analytics strategy enhances quality across an organization, garnering success under the new reimbursement models. The quantitative methods of analytics are vital to both creating and enhancing value across the health care delivery system over time.
Health care providers who are successful under value-based reimbursement realize that an effective, well-executed data analytics strategy has the power to drive success. Data analytics helps clinicians identify and understand how and when their health care decisions impact cost, profitability, and care quality and where they stand in relationship to their peers. This greater understanding of cost and quality enables them to exceed the peer performance benchmarks and receive greater compensation. 19 20
3.1.8. Risk Management
Risk management in health care comprises the clinical and administrative systems, processes, and reports employed to detect, monitor, assess, mitigate, and prevent risks. Using risk management tools, health care organizations proactively and systematically safeguard patient safety as well as the organization’s assets, market share, accreditation, reimbursement levels, brand value, reputation, and community standing.
Financial risk is increasingly shifting from payers to providers, which requires a broader view of risk management.
With the value-based care movement and today’s risk-bearing models such as bundled payments and CMS’s pay for performance programs, financial risk is increasingly shifting from payers to providers. This new landscape requires a broader view of risk management.
Hospitals and other health care systems are now expanding their risk management programs away from traditional reactive models that focus on promoting patient safety, preventing legal exposure, and reducing medical errors that jeopardize an organization’s ability to achieve its mission and protect against financial liability.
They are shifting to more-complex models that are increasingly proactive and view risk more broadly. These models include cybersecurity and protection amidst the fast pace of medical science and the industry’s ever-changing regulatory, legal, political, and reimbursement climate. 21
3.1.9. Business
Business analytics is “the study of data through statistical and operations analysis, the formation of predictive models, application of optimization techniques, and the communication of these results to customers, business partners, and college executives.” Business analytics requires quantitative methods and evidence-based data for business modeling, provision of actionable recommendations, and decision making to effect practical, data-driven changes in an organization. Business analysts focus on how to apply the insights they derive from data. Their goal is to draw concrete conclusions about a business by answering specific questions about why things happened, what will happen, and what should be done.
Business applications of data analytics usually sit at the top of data analytics hierarchy. They pull data and insights from different data systems as well as other data analytics applications including clinical, population heath, quality, referrals, value-based care, risk-management, human resource, and financial. 22 23
3.2. Sources of Data/Information
3.2.1. EHRs (including Long-Term Services and Supports and Pharmacy EHRs)
An electronic health record (EHR) is a longitudinal electronic record of patient health information generated by one or more encounters in any care delivery setting. Included in this information are patient demographics, progress notes, problems, medications, vital signs, past medical history, immunizations, laboratory data, and radiology reports. The EHR automates and streamlines the clinician’s workflow. The EHR can generate a complete record of a clinical patient encounter—supporting other care-related activities directly or indirectly via interface—including evidence-based decision support, quality management, and outcomes reporting. 24 25
When a health care organization has strong and organized financial management plans, it is able to provide efficient health care to all its patients.
3.2.2. Financial System Data
Accurate financial data are essential for a health care organization to succeed in today’s rapidly evolving business environment. The primary role of finance in health care organizations is to plan for, acquire, and use resources to maximize the organization’s efficiency. Specific activities include planning and budgeting. Health care organizations need to manage money and risk in a way that helps to achieve the organization’s financial goals. When a health care organization has strong and organized financial management plans, it is able to provide efficient health care to all its patients. 26 27
3.2.3. Referral System
A referral can be defined as a process in which a health worker at a one level of the health system, having insufficient resources (drugs, equipment, skills) to manage a clinical condition, seeks the assistance of a better or differently resourced facility at the same or higher level to assist in, or take over the management of, the patient’s case.
An effective referral system ensures a close relationship among all levels of the health system and helps to ensure people receive the best possible care closest to home. It also assists in making cost-effective use of hospitals and primary health care services.
Experienced staff from the hospital or district health office may provide support to health centers and outreach services, which helps build capacity and enhance access to better quality care. For example, in resource-limited settings, a high proportion of patients seen at the outpatient clinics at secondary facilities could be appropriately looked after at primary health care centers at a lower overall cost to the patient and the health system.
A good referral system can help to ensure the following:
- Patients receive optimal care at the appropriate level without unnecessary costs.
- Facilities are used optimally and cost effectively.
- Patients who most need specialist services can access them in a timely way.
- Primary health services are well utilized, and their reputation is enhanced. 28
3.2.4. Telehealth and Remote Patient Monitoring (RPM) Technologies
Telehealth can be defined as the use of electronic information and telecommunications technologies to provide access to health assessment, diagnosis, intervention, consultation, supervision information, and education across a distance.
Telehealth technologies include telephones, facsimile machines, electronic mail systems, video conferencing, and remote patient monitoring (RPM) devices, which are used to collect and transmit data for monitoring and interpretation. Specifically, RPM is a type of home telehealth that enables patient monitoring as well as transfer of patient health data to a healthcare provider.
There are many uses of telehealth and RPM such as patient education and self-management, pre- and post-acute management of chronic conditions, post-acute patient stabilization by monitoring disease conditions and detecting exacerbation, and long-distance routine check-ups/treatment.
Benefits of telehealth and RPM include improved health outcomes, fewer hospitalizations and readmissions, better quality of life, and lower costs for payers and care providers. 29 The LeadingAge CAST Telehealth and RPM Selection Tool can help you select the right telehealth and RPM technologies to meet your organization’s needs.
Medication management technologies facilitate safe and effective use of medications.
3.2.5. Medication Management Technologies
Medication management technologies facilitate safe and effective use of medications. The process of medication management involves several phases:
- Prescribing in the Outpatient Setting or Ordering in the Hospital and Long-term Care Settings: Involves selecting a medication from the pharmacy benefit list and obtaining appropriate dispensing authorization.
- Order Communication, including Transmission and Verification: Involves the clinician transmitting a prescription or order, plus the pharmacist’s subsequent review and approval of this transmission.
- Dispensing and Administration: Involve providing a supply of medication to an individual for whom it is ordered, giving the patient the prescribed dosage, and documenting the medication’s administration.
The LeadingAge CAST Medication Management Selection Tool can help you choose the best medication management technologies for your organization. 30
3.2.6. Functional Assessment and Activity Monitoring Technologies
A functional assessment is the process that captures and analyzes a person’s general behavior and capabilities to interact with the world in order to determine his or her changing needs. Functional assessments should include two types:
- Physical: Covers sensory and mobility impairments: vision, hearing, gait, control over bodily functions, mobility, and ADL/IADL activities such as bathing, dressing, and toileting.
- Cognitive: Covers behavioral changes, depression, memory decline, and general cognitive functions such as recall, sequencing, multi-tasking.
Functional decline can be an early sign of cognitive decline, adding a time dimension to the cause-and-effect relationship between the two assessment types.
However, assessing functional decline is challenging. Monitoring technologies have long represented a field of interest for healthcare professionals in that they promise a wealth of information and better focused and personalized care. These technologies range from embedding sensors in the fixed environment to mobile, wearable, or personal devices. They vary in the way the monitored individual interacts with the devices. Some are completely passive, and others require specific interactions with sensing devices and/or user interfaces. 31
LeadingAge CAST has prepared a Functional Assessment and Activity Monitoring Technology Selection Tool that can help you find the best tech solutions to meet your organization’s needs in this area.
3.2.7. Wellness Systems
Health and wellness technologies include health promotion technologies, behavioral and health status monitoring systems, telehealth and telemedicine systems, and medication management technologies, which focus on seniors’ physical health and wellness.
Also classified under this category are cognitive assessment technologies, reminder systems and cognitive monitoring, and stimulation technologies, which focus on seniors’ mental health and wellness. These technologies include physical exercise and rehabilitation technologies. 32 See the LeadingAge CAST Health and Wellness Technologies for additional resources on these topics.
3.2.8. HR Systems
A human resources management system (HRMS) is a type of information system (IS) that is designed to manage an organization’s computerized and automated human resources (HR) processes. It is a combination of hardware and software resources that hosts and provides most, if not all, of an HR department’s business logic. An HRMS is also known as a human resources information system (HRIS).
Staff costs account for 65 – 80% of health care organizations’ total operating budgets. Therefore, effective HR management is essential, from both a clinical and financial perspective. The health care industry, which is highly regulated, presents several challenges to its HR professionals: employee turnover, leading and development opportunities, ensuring compliance in the health care industry, employee burnout, and so on. Understanding these challenges is essential to overcome them and offer better health care services. 33 34 35
Laboratory data enable health care professionals to make appropriate evidence-based diagnostic or therapeutic decisions.
3.2.9. Laboratory Data
Laboratory data enable physicians and other health care professionals to make appropriate evidence-based diagnostic or therapeutic decisions for their patients. Laboratory information has a profound impact on patient diagnosis. Tests, whether classified as screening or diagnostic, are essential elements of protocols used to diagnose and manage specific diseases and conditions.
Algorithmic testing models, designed with clinicians, are used to guide the diagnostic process to obtain the right information at the right time for a given patient, shorten the time to diagnose and the length of stay, and improve utilization of laboratory services.
These models assist in rapidly identifying disease, assessing severity of disease, creating a therapeutic plan, and managing/monitoring treatment outcomes. The more efficient the testing protocol, the shorter the length of inpatient stay or outpatient encounter, the faster the implementation of therapy, and the lower the overall cost of care. 36
3.2.10. Marketing Data
Marketing data on services, programs, and offerings help determine the best target audience for a specific marketing campaign. Data tell marketers how to approach members of those various demographics in a way that builds and nurtures trust. People with specific health care needs, especially, are quicker to form relationships with brands that do the most to win their trust.
When marketing to boards, trustees, investors, and the like, big data, data analytics, and the market insights they provide are important marketing tools. Businesses, organizations, and individuals that put large sums of money into products, treatments, and services want to know unequivocally that their money is being spent well. They need hard evidence that their investments have better than good chances of getting significant returns on investment. 37
3.2.11. CRM Data
A health care customer relationship management system (CRM) is a CRM designed specifically for use by health care organizations. Health care CRMs weave together multiple sources of data to provide a comprehensive view into patient habits and activities. This data may include consumer and patient demographics; psychographics; social, behavioral, clinical, financial, website, call center, and provider credentialing data; and the like.
One kind of health care CRM helps a health care organization stay in contact with their patients; the other keeps the organization in contact with referring organizations.
The primary goal of a health care CRM system is to engage, acquire, and retain patients. There are two basic types of health care CRMs. One is for a health care organization to stay in contact with their patients; the other is for a health care organization to stay in contact with referring organizations. Others could be used for marketing or connecting with donors for fundraising, which are particularly common among not-for-profit providers. 38 39
3.2.12. Engagement Data
Patient engagement refers to strategies that empower patients to be active in their own health care and motivate them to improve their personal health outcomes and reduce costs. Patient engagement is most effective when driven by the care team.
Physician access to comprehensive, reliable data is one vital ingredient for efficiently engaging patients. With this data in hand, care teams are prepared to engage the patients who need it most while gaining efficiency in the practice. The practice receives the data, an automated system flags the patient, the care team engages the right patients to come into the office, and the physician intervenes where that clinical expertise is required most.
However, in the aging services sector, engagement data may also include participation in social and wellness activities and use of certain facilities, resources, services, or even technologies, like resident portals. 40
3.2.13. Public Health Data
Public Health Data (PHD) is a unique surveillance and research tool that provides access to timely, linked, multi-year data to enable analyses of health priorities and trends, such as the current opioid epidemic and persistent inequities in maternal and child health.
Public health datasets fall into two broad categories:
- Counts: One category includes counts of individual health-related events or services. Counts are made of individuals who are provided specific health services. These counts are normally geographically and chronologically proscribed.
- Descriptions: A second category of data sets describes populations using sampling techniques. Data collection systems that create these datasets survey a subset of a reference population. The reference population could be as broad as all citizens of the United States, or it may be more narrowly constrained. 41 42
The value of electronic exchange is the standardization of data.
3.2.14. HIE/Health Registry Data
Health information exchange (HIE) is the mobilization of health care information electronically across organizations within a state, region, community, or network of providers. In practice, the term HIE may also refer to the health information organization (HIO) that facilitates the exchange.
Participants in data exchange are called in the aggregate health information networks (HIN).
Electronic HIE allows doctors, nurses, pharmacists, other health care providers, and patients to appropriately access and securely share a patient’s vital medical information electronically. Electronic sharing improves the speed, quality, safety, and cost of patient care.
The value of electronic exchange is the standardization of data. Once standardized, the data transferred can seamlessly integrate into the recipients’ EHR, further improving patient care. There are currently three key forms of health information exchange:
- Directed Exchange: The ability to send and receive secure information electronically between care providers to support coordinated care.
- Query-based Exchange: The ability for providers to find and/or request information on a patient from other providers. Query-based exchange is often used for unplanned care.
- Consumer Mediated Exchange: The ability for patients to aggregate and control the use of their health information among providers. 43 44 The LeadingAge CAST Health Information Exchange Online Selection Tool can help your organization choose the best HIE modalities, entities, and networks to meet its needs.
3.2.15. Regulatory Assessments (such as OASIS, MDS)
OASIS: The Outcome and Assessment Information Set (OASIS) is the patient-specific, standardized assessment used in Medicare home health care to plan care, determine reimbursement, and measure quality.
It is a comprehensive assessment designed to collect information on nearly 100 items related to a home care recipient’s socio-demographic information, clinical status (including diagnosis codes), functional status, psychosocial status, and service needs.
The OASIS is completed upon admission, discharge, transfer, and change in condition for all Medicare and Medicaid, non-maternity, and non-pediatric beneficiaries. OASIS data are collected by a home care clinician such as a nurse or therapist via direct observation and interview of the care recipient and/or caregiver. 45 46
MDS: The Minimum Data Set (MDS) is part of the federally mandated process for clinical assessment of all residents in Medicare and Medicaid certified nursing homes. This process provides a comprehensive assessment of each resident’s functional capabilities and helps nursing home staff identify health problems.
MDS assessments are completed for all residents in certified nursing homes, regardless of source of payment for the individual resident. MDS assessments are required for residents on admission to the nursing facility, periodically, and on discharge. All assessments are completed within specific guidelines and time frames. In most cases, participants in the assessment process are licensed health care professionals employed by the nursing home. MDS information is transmitted electronically by nursing homes to the national MDS database at CMS. 47
3.2.16. Public Reporting (including Public Health and Quality Data)
Public reporting (PR) is a mechanism of “providing data about a health care structure, process, or outcome publicly available or available to a broad audience free of charge or at a nominal cost, in order to be able to compare data across providers or to a national/regional data report on performance for which there are accepted standards or best practices.”
Public reporting may provide more transparency and accountability of health care providers.
Public release of quality and clinical performance of the health care providers is becoming increasingly common among health care systems worldwide. Policy and decision-makers in a demand-driven health care system are becoming more interested in having information about quality performance, and PR has been proposed as a way to provide more transparency and accountability of health care providers.
Constant improvement of the quality of care should be one of the top priorities of health care providers. According to the theory of PR, health care users are expected to inform themselves about the quality of the health care system before selecting the provider. Users would select and reward providers with high performance, while users would avoid low performers and stimulate those providers to improve their performance. 48
3.2.17. Patient Generated Data
Patient-generated health data (PGHD) are data created, recorded, or gathered by or from patients, family members, or caregivers to help address a medical concern. This data complements clinical data, providing a more comprehensive view of patients’ health.
Patients, rather than providers, are mainly responsible for capturing or recording PGHD and determining how to share or distribute the data to healthcare providers.
PGHD can include personal health records (PHR), treatment history, biometric data, symptoms, and lifestyle choices. Data from blood glucose monitoring, blood pressure readings using home health equipment, and exercise and diet tracking using a mobile app or wearable device are other examples of PGHD. 48
3.2.18. Social Determinants of Heath (SDOH)
The World Health Organization defines SDOH as “the conditions in which people are born, grow, live, work, and age.” It adds that money, power, and resources at the global, national, and local levels shape these conditions.
SDOH are mostly responsible for health inequities: the differences in health status seen within and between countries. SDOH data captures daily patient life, including socioeconomic and employment status, living and social support environment, etc. SDOH data captures patient choices and genuine experiences and gives richer insights into factors impacting health than do traditional health care encounters, an especially important consideration with complex and underserved populations. 50 51
Medical claims information can be used to evaluate the delivery and cost of health care.
3.2.19. Claims Data
Medical claims data is information found in medical billing claims forms filed submitted by medical providers to government and private health insurers on behalf of a group or population. Claims databases collect information on millions of care provider interactions, like doctors’ appointments, bills, insurance information, and other patient-provider communications.
The information obtained from medical claims can be used to evaluate the delivery and cost of health care as part of evidence-based public health programs. Medical claims data is also known as administrative data and health claims data.
Most medical providers’ billing methods use uniform, predefined codes identifying the healthcare services provided. This consistency across multiple providers allows the information to be easily collected and compared. Like other medical records, claims data come directly from notes made by the health care provider, and the information is recorded at the time patient sees the doctor. 52 53 54
3.3. Core Services and Consulting Offered by Data Analytics Providers
3.3.1. Data Management and Engineering
3.3.1.1. Data Cleansing
Data cleansing or data cleaning is the process of detecting and correcting (by replacing, modifying, or deleting) incomplete, incorrect, inaccurate or irrelevant records from a given storage resource, such as a record set, table, or database.
Data cleansing may be performed interactively with data wrangling tools or as batch processing through scripting.
For example, to improve patient demographic data quality, an organization may prevent potential patient duplications through data cleansing processes. Once a patient has produced identification, if there is an existing record in the system, multiple demographic items can help with data validation.
Health care organizations need to develop a standard and consistent data cleansing process and establish criteria for what events trigger the data cleaning processes and/or efforts. The benefits of implementing standard data cleansing include but are not limited to the following:
- Improved data accuracy.
- Elimination of redundancy of records/data.
- Savings in effort and cost.
- Errors traced to root causes preventing downstream errors.
- Increased resource allocation efficiency through cumulative experience.
- Improved and sustainable data quality.
- Improved effectiveness of business processes, minimizing errors. 55 56 57
3.3.1.2. Integrity Audits
Data integrity refers to the accuracy and consistency (validity) of data over their lifecycle. Compromised data or loss of sensitive data such as personal health information (PHI) present with a lot of dangers for organizations. For this reason, maintaining data integrity is a core focus of many enterprise security solutions.
Data integrity audits go far beyond data “scrubbers” or basic data validation checks. Audits should check each patient record for accuracy and provide feedback from clinical, regulatory, financial, and risk management perspectives. Each patient record should be checked for logical and clinical coding accuracy with recommended actions when inaccurate, incomplete, or inconsistent information is identified.
An example of a data integrity check is to inspect the parent and child linkage, such as to ensure the patient is correctly represented as the mother of another patient. 58 59 60
Be sure to access the LeadingAge CAST Cybersecurity White Paper and other resources to help your organization understand cybersecurity threats, how to mitigate them, and how to respond if attacked.
3.3.1.3. Migration/Integration
Data Migration: Data migration is the process of transporting data between computers, storage devices, or formats. Data migration is categorized as storage migration, database migration, application migration, and business process migration.
There are various reasons for data migration, like replacing or upgrading storage devices, server maintenance, website merging, disaster recovery, and data center relocation. During data migration, software programs or scripts are used to map system data for automated migration. It is essential that organizations have effective planning and validation mechanisms in place and good documentation to minimize migration impacts on compatibility and performance issues.
Data Integration: Data integration is the process of combing data from multiple sources and providing the user a comprehensive view.
Data integration can happen in different situations, such as in commercial and scientific applications. For example, two health care companies might require merging their databases. Similarly, combining research results into a single storage might be required.
Data integration is used to share data among business processes, functional units, and multiple systems between and within organizations, such as different EHR systems for different lines of business, or EHR and financial data, etc. 61 62
3.3.1.4. Consolidation
Data consolidation refers to the collection and integration of data from multiple sources into a single destination. During this process, different data sources are put together, or consolidated, into a single data storage.
Data consolidation techniques reduce inefficiencies, like data duplication, as well as costs.
Because data comes from a broad range of sources, consolidation allows organizations to more easily present data, while also facilitating effective data research and analysis. Data consolidation techniques reduce inefficiencies, like data duplication, as well as costs related to reliance on multiple databases and multiple data management points. 63
3.3.1.5. Warehousing/Clearinghouse
The data warehouse is an alternative form of data storage from the conventional relational database structures commonly used in single software applications.
It is more suitable a view of data that is subject-oriented, rather than application-oriented. It receives data from one or multiple relational databases, stores large or massive amounts of data, and emphasizes permanent storage of data received over periods of time.
According to the U.S. Department of Health & Human Services, a health care clearinghouse is a “public or private entity, including a billing service, repricing company, or community health information system, which processes non-standard data or transactions received from one entity into standard transactions or data elements, or vice versa.”
For example, a medical claims clearinghouse is a third-party system that interprets claim data between different provider systems and insurance payers’ systems. Typically, a health care claims clearinghouse will “scrub” or check a claim for errors before submitting. Once a response is received, the electronic claims submission clearinghouse transmits either a denial or acceptance back to the health care provider. 64 65
3.3.1.6. Application Program Interface (API) Development
An application programming interface (API) is a computing interface that defines interactions between multiple software intermediaries. In brief, an API allows two applications to talk to each other.
Each time you use an app like Facebook, send an instant message, or check the health care appointment alerts on your phone, you are using an API. When you use an application on your mobile phone, the application connects to the internet and sends data to a server. The server then retrieves that data, interprets it, performs the necessary actions, and sends it back to your phone. The application then interprets that data and presents you with the information you wanted in a readable way.
An API can be entirely custom, specific to a component, or designed based on an industry standard to ensure interoperability. 66 67
3.3.2. Core Data Analytic Services
3.3.2.1. Data Exploration and Visualization
Data exploration, also known as exploratory data analysis (EDA), provides a set of simple tools to achieve basic understanding of the data.
Data exploration approaches involve computing descriptive statistics and data visualization.
Data exploration approaches involve computing descriptive statistics and visualization of data. These approaches can expose the structure of the data, the distribution of the values, and the presence of extreme values or outliers. They can also highlight the inter-relationships within a dataset. A visual plot of data points provides an instant grasp of all the data points condensed into one chart. (See Section 2.2.1, Descriptive Analytics.) 68
3.3.2.2. Modeling/Model Building
Data modeling is the process of producing a descriptive diagram of relationships between various types of information that are stored in a database. One of the goals of data modeling is to create an efficient way of storing information while still providing for complete access and reporting.
Model building is a crucial skill for all data scientists, whether they are doing research design or architecting a new data store for an organization. The ability to think clearly and systematically about the key data points to be stored and retrieved, and how they should be grouped and related, is what the model building component of data science is all about.
A statistical model is a mathematical representation (or mathematical model) of observed data. When data analysts apply various statistical models to the data they are investigating, they can understand and interpret the information more strategically.
Rather than sifting through the raw data, this practice allows them to identify relationships between variables, make predictions about future sets of data, and visualize the data so that non-analysts and stakeholders can consume and leverage it. (See Section 2.2.3, Predictive Analytics, and Section 2.2.4., Prescriptive Analytics.) 69 70
3.3.2.3. Learning Capabilities
The heart of data science is machine learning models and neural networks, which are statistical models that can be used to extract patterns from data using the power of modern computing to leverage statistics. (See Section 3.3.2.2, Modeling/Model Building.)
Statistical Learning: Statistical learning refers to a vast set of tools for understanding data. These tools can be classified as supervised and unsupervised. Broadly speaking, supervised statistical learning involves building a statistical model for predicting or estimating an output based on one or more inputs.
With unsupervised learning there are inputs but no supervising output; nevertheless, we can learn relationships and structure from the data. (See Section 3.3.2.2., Modeling/Model Building, for model building definitions, as well as Section 2.2.3., Predictive Analytics, and Section 2.2.4., Prescriptive Analytics.)
Data Science: As a broad term, data science means pulling information out of data, or converting raw data into actionable insights. Data scientists are knowledgeable in statistics and their subject matter such as health care clinical data, and they use computer programming skills to tell the computer how to leverage data to derive insights.
Data scientists augment traditional data analysis by automating the process of insight delivery through code. This automation can bring efficiency gains and new depths of insight to analytics. It also enables real-time predictive analytics by reducing the time it takes to go from data to prediction.
Health care leaders must understand and become students of data science.
Importance of Data Science to Health care: Data will continue to be a dominant factor in health care delivery and outcome improvement. For organizations to successfully navigate the complexity of a data-driven world and embrace improvement opportunities, health care leaders must understand data science. They must also become students of data science, understanding how it is working in other companies and its implications for their health systems. And, if they have not already, leaders must start developing data scientist skills on their teams.
Some machine learning models, such as regularized regression and decision trees, lend themselves well to deriving insights and explaining patterns in data, such as which clinicians are over-prescribing. Other machine learning models, such random forests and neural networks (deep learning), are primarily used for predicting things like a patient’s likelihood of readmission after discharge.
In recent years, progress in statistical learning has been marked by the increasing availability of powerful and relatively user-friendly software, such as R and Python. Health care has long relied on data and data analysis to understand health-related issues and find effective treatments.
With statistical learning, the industry can find efficient, cost-effective ways to harness vast amounts of existing health care data.
Today, health care needs to optimize patient outcomes with evidence-based practices more than ever. With statistical learning, the industry can find efficient, cost-effective ways to harness vast amounts of existing health care data—to maximize data’s potential to transform health care with faster, more accurate diagnosis and more effective, lower-risk treatment. 71 72
3.3.2.4. Decision Support
A decision support system (DSS) is a computer-based application that collects, organizes, and analyzes data to facilitate decision-making for management, operations, and planning.
A well-designed DSS helps decision makers identify and solve problems and make decisions through the compilation of a variety of data from many sources: raw data, documents, personal knowledge from employees, management, executives, and business models.
An example of a DSS in health care is the clinical decision support (CDS). A CDS may provide clinicians, staff, patients, or other individuals with knowledge and person-specific information, intelligently filtered or presented at appropriate times, to enhance health and health care.
CDS encompasses a variety of tools to enhance decision-making in the clinical workflow, including the following:
- Computerized alerts and reminders to care providers and patients.
- Clinical guidelines.
- Condition-specific order sets.
- Focused patient data reports and summaries.
- Documentation templates.
- Diagnostic support.
- Contextually relevant reference information.
- CDS can significantly impact improvements in health care quality, safety, efficiency, and effectiveness. 73 74
3.3.2.5. Dashboards
Dashboards are interactive decision-support tools with the purpose of visualizing data to gain insights. “A dashboard is a visual display of data used to monitor conditions and/or facilitate understanding.”
Health care dashboards have become an essential tool in outcome improvement. They provide important insights and near real-time data, helping managers and clinicians make better decisions about patient care.
Dashboards tell systems what is happening currently, using interactive metrics with drill-down capabilities. Dashboard visualizations are more in-depth with gauges, charts, and graphs, making them great tools for tracking outcomes of improvement goals.
They create connections directly to live systems and the enterprise data warehouse (EDW) to enable comparisons of current and historical health care data and allow for daily, constant monitoring of items affecting outcomes of interest—for example, view today’s readmissions, view triage wait times, and view current or turnaround time.
However, note that today, decision-support tools are evolving beyond traditional dashboards into true real-time reporting and customizable self-service tools that meet the ever-growing demands of health care data. 75 76 77
3.3.2.6. Benchmarking/Scorecard Across Sites/Providers/Markets
Benchmarking: Benchmarking is a process where an organization measures its performance nationally, regionally, and locally against peers as well as competitors across key indicators to discover if there is a gap in performance that can be closed through appropriate improvements. Studying other organizations can highlight what it takes to enhance your organization’s efficiency and become a bigger player in the industry.
Scorecards tell health systems how they are performing overall, while dashboards tell systems what is happening now.
Scorecards: Scorecards provide a high-level, one-page overview of a health system’s long-term, strategic outcomes improvement goals: for example, reduce readmissions, increase average patient satisfaction, reduce average or turnaround times. Scorecards tell health systems how they are performing overall, while dashboards tell systems what is happening now.
Scorecards are long-term. They are slow to change, as goals change over weeks, months, or years. They leverage an enterprise data warehouse (EDW), which combines different data sources to track strategic goals. The data latency caused by daily or weekly goals is acceptable for the long-term strategic goals of an organization captured in a scorecard.
Scorecards are typically organized by clinical domains or specialty. They measure performance against goals, such as on target, at risk, or off target, using simple visualizations—raw numbers, arrows, and stoplights. Scorecards are usually web accessible, mobile-friendly on tablets and smartphones, and ever-present because they are not pushed or pulled reports.
For example, an organization can collect data for a month or other period and compare its performance against the industry averages. Once a set of expected values is established and recently acquired data are available, you can begin to make better business decisions.
Providing transparency and setting targets for each facility relative to peer benchmarks achieves improvement across the entire network.
When compared to industry averages, you can see which of your core components is lacking, and then you can take the proper steps towards improvement. All facilities within a referral network, for example, are ranked by their outcomes in measures for each domain, showing how each facility is performing compared to their peers.
Providing transparency and setting targets for each facility relative to peer benchmarks achieves improvement across the entire network. This comparative metric is as critical as understanding your data in comparison with your past data. 78 79 80
3.3.3. Additional Services and Consulting
3.3.3.1. Population Health Management
Population health management refers to the process of improving clinical health outcomes of a defined group of individuals through improved care coordination and patient engagement supported by appropriate financial and care models. An example is managing diabetes populations.
Diabetes is representative of the chronic health conditions at the root of our health care challenges. Managing diabetes is a major emphasis of providers, payers, associations, accountable care organizations (ACOs), and government programs seeking to improve the quality and cost of care nationwide. By establishing a health care EDW, you create a data foundation that enables you to manage your diabetes population in sophisticated ways.
For example, you can do the following and much more:
- Create and maintain a robust diabetes registry.
- Use diagnosis codes supplemented by clinical information to continue to define and refine your diabetes population.
- Identify patients who are not up to date on tests, including A1C, fasting lipids, blood pressure, microalbumin, and more.
- Establish benchmarks and compare those to state and national benchmarks.
- Identify diabetic patients with the highest risk of high cholesterol, hypertension, or heart disease.
From this list, you can actively prioritize and target interventions to specific patient groups. With good use of data, you enable each individual patient to better manage his or her own diabetes by the numbers. 81 82
3.3.3.2. Disease Management (including Chronic Disease Management)
Disease management is the concept of reducing health care costs and improving quality of life for individuals with chronic conditions by preventing or minimizing the effects of the disease through integrated care.
Disease management has emerged as a promising strategy for improving care for those with chronic conditions.
People with chronic conditions usually use more healthcare services that often are not coordinated among providers, creating opportunities for overuse or underuse of medical care. Chronic disorders commonly managed through disease management programs are diabetes mellitus, congestive heart failure (CHF), chronic obstructive pulmonary disease (COPD), coronary artery disease (CAD), asthma, and hypertension.
Disease management is a promising strategy for improving care
for those with chronic conditions.
Examples include the following:
- Disease management is an approach to health care that teaches patients how to manage a chronic disease. One step in teaching disease management to a diabetes patient is to show her how to keep her blood sugar levels within a healthy range.
- Many types of devices and health program delivery systems can be considered part of disease management. For example, simple push notifications remind obese patients to be aware of food choices or remind heart disease patients to take their medications. 83 84 85
3.3.3.3. Quality Management (Including Five-Star Rating)
Quality management in health care is used to measure the health benefits of doctors’ and hospitals’ work and improve patient outcomes, managing quality and patient safety through a combined proactive and reactive approach.
Quality management helps reduce errors and improve patient care. The safety and effectiveness of treatment are two of the most critical measures of quality.
For example, a patient may have received the wrong medication, but what were the steps involved in getting that medication to the patient? To detect the root cause of an adverse event, the organization must analyze the processes that led to the event and then address the factors which should and could have prevented harm from reaching the patient.
Another example of quality management at the facility level is the Centers for Medicare & Medicaid Services (CMS) Five-Star Quality Rating System. CMS created Five-Star to help consumers, their families, and caregivers compare nursing homes more easily and identify areas about which they may want to ask questions.
The Nursing Home Compare website features a quality rating system that gives each nursing home a rating of between one and five stars. Nursing homes with five stars are considered to have quality much above average, and nursing homes with one star are considered to have quality much below average. There is one overall five-star rating for each nursing home, plus a separate rating for each of the following three sources of information: health inspections, staffing, and quality measures (QMs). 86 87 88
3.3.3.4. Financial Management
The primary role of financial management in health care organizations is to manage money and risk in a way that helps to achieve the organization’s financial goals. When a health care organization has strong and organized financial management plans, it is able to provide efficient health care to all its patients.
Basic financial management activities in health care organizations include evaluation and planning, long-term investment decisions, financing decisions, working capital management, contract management, and financial risk management.
When a health care organization has strong and organized financial management plans, it can provide efficient health care to all its patients.
Financial management (corporate finance) involves applying theory and concepts developed to help managers make better decisions. For example, health care providers, such as large physician practices and hospitals, may decide to offer expanded tests or treatments by buying new medical equipment. Helping to make the decision and finding the best way to pay for it are both part of financial management. 89 90 91
3.3.3.5. Cost Accounting
Cost accounting is a system for recording, analyzing, and allocating cost to specific individual services that patients receive, such as tests, procedures, medications, room, and board. It is the process of estimating and classifying costs that a health care organization incurs.
Costs can be analyzed at the organizational or departmental level, but increasingly, health care organizations seek ways to analyze them at the service/individual patient level.
For example, hospitals should use uniform rules of cost accounting, as doing so would enable them to compare cost information and evaluate available resources. The complete system of cost accounting in hospitals should consist of three elements:
Risk management safeguards patient safety and the organization’s assets, market share, accreditation, reimbursement levels, and more.
3.3.3.6. Risk Management
Risk management in health care comprises the clinical and administrative systems, processes, and reports employed to detect, monitor, assess, mitigate, and prevent risks.
By employing risk management, health care organizations proactively and systematically safeguard patient safety as well as the organization’s assets, market share, accreditation, reimbursement levels, brand value, and community standing.
In health care, risks include but are not limited to faulty equipment and other hazards, medical malpractice, and procedures. Managing these and other risks is pivotal within the health care industry to keep people safe and secure and to keep costs down. Once risk management strategies are put into place, hospitals, long-term care facilities, and other health care organizations can minimize the potential for loss.
For example, the Centers for Disease Control and Prevention (CDC) recently published research that found that prolonged urinary catheter use is the leading risk factor for catheter-associated urinary tract infections. Based on this information, a risk management plan was implemented that required physicians to regularly evaluate the catheter. The result was a decrease in patient risk. 94 95 96
3.3.3.7. Business Intelligence
Business intelligence is the collection and analysis of data for the purpose of improving operations, reducing inefficiencies, guiding strategies, improving decision-making, and more.
Patient wait time and readmission rate can be key performance indicators for BI analytics.
Health care business intelligence (BI), or health care analytics, seeks to leverage vast amounts of patient data to gain insights into key health areas such as clinical care, financial operations, and administration with a focus on improving care and cutting costs.
Examples of key performance indicators for BI analytics are as follows:
- Patient Wait Time: By calculating the average amount of time a patient must wait between checking in and seeing a provider, organizations can gain insight into staffing, scheduling, and patient satisfaction.
- Readmission Rate: Preventable readmissions cost hospitals tens of thousands of dollars each year. Tracking this rate can help inform strategies like infection prevention, patient education and discharge planning, monitoring high-risk patients, and sepsis identification. 97
3.3.3.8. Marketing/ Communication
Health marketing involves creating, communicating, and delivering health information and interventions using customer-centered and science-based strategies to protect and promote the health of diverse populations.
For example, the CDC develops a new rapid HIV testing kit that provides results in half the time of current tests. To efficiently market the new product, the testing kits are announced by the national media and medical journals. The CDC sends free samples of the new testing kits to each of the state health departments, who deliver them to local health departments, clinics, and hospitals. Here is how the CDC used the marketing mix:
• Product: New HIV testing kit; released by a credible research agency.
• Price: Free for trial use.
• Place: Widely and evenly distributed throughout states using state and local health departments.
• Promotion: National media publicizes to public; journals inform medical community.
As demonstrated in these examples, each of the marketing mix elements must be present in the marketing process. Tailoring the elements to match the target market and using each component in coordination with one another leads to a successful marketing mix. 98
3.3.3.9. HR Management Including Time and Attendance Tracking
Human resource departments in a medical or health care facility face the challenge of handling large-volume employee data; the need for a single, integrated system for employee records; thorough analysis; detailed reporting; and periodic audits.
An HR management system is designed to manage employee work hours and absenteeism, and aid in recruiting and training new employees more efficiently. The system is built around a central repository of employee data that keeps track of contract details, benefits, vacations, training, and qualifications.
A time and attendance system enables companies to find better ways to increase productivity and reduce administration costs and time.
A time and attendance system for hospitals or nursing homes monitors employees’ working times. It also collects attendance information that companies can analyze to find better ways to increase productivity and reduce administration costs and time. Organizations can analyze ways to accommodate various work rules and regulatory compliance and seamlessly work with different currencies. They can check payroll, plan future work, and run “what if” scenarios. 99 100
3.3.3.10. Payroll-Based Journal (PBJ)
CMS has developed a system for facilities to submit staffing information, the Payroll-Based Journal (PBJ).
This system allows staffing information to be collected on a regular and more frequent basis than previously collected. It is auditable to ensure accuracy. All long-term care facilities have access to this system at no cost. CMS uses the data from the PBJ to analyze staffing patterns and populate the staffing component of the Nursing Home Compare website. (See Section 4.1.1.3, Quality Management.)
Once the company has completed the registration process to facilitate filing a PBJ, it must supply several data points for each individual registered employee. Examples include the employee unique ID, hire date, termination date, pay type code, and non-exempt/exempt/contract status. For direct care workers, the workday and date, the job category code, the job title code, and the hours worked per day/date are required.
It is important to note that if a contractor or individual is paid directly by Medicare, those hours cannot be reported within your PBJ submission. 101 102 103
Having interoperability among disparate systems internally and externally and/or a connection to an HIE can greatly enhance your ability to perform data analytics.
4. Enabling Technologies
4.1. Interoperability and Health Information Exchange Platforms
Interoperability means that two disparate systems are able to communicate with one another to exchange data. To end users and many in the industry, interoperability means every product works with others seamlessly. Unfortunately, not even the most highly integrated suite of components in a product fully does so.
When modules or components are integrated, they generally have been built by the same group that did the original development and programming, have similar design characteristics, and can exchange most data. In general, the components or modules in highly integrated suites of products work well together, but they will not work with any other vendor’s product without specialized interfacing.
Recently, unprecedented efforts have begun to develop, implement, and use interoperability standards and standard data elements in electronic health records (EHRs) to support interoperability. Many EHR vendors have created APIs to get data out of systems and support interoperability, interfacing, and information exchange between systems and providers.
Health information exchanges, or HIEs, are organizations or frameworks that allow for the secure and timely exchange of protected health information (PHI) between providers, caregivers, health insurers, and other organizations that have an interest in a patient’s care. These exchanges can be largely technical and can be a multi-stakeholder partnership where otherwise competitive organizations can collaborate on use cases that create better value for participating entities and better outcomes.
Having interoperability among disparate systems internally and externally and/or a connection to an HIE can greatly enhance your ability to perform data analytics.
4.2. Structured and Unstructured Data
Structured Data: Structured data refers to any data that resides in a fixed field within a record or file. Each field has a description associated with it and sometimes a specific data range.
Structured data has the advantage of being easily entered, stored, queried, and analyzed. At one time, because of the high cost and performance limitations of storage, memory, and processing, relational databases and spreadsheets using structured data were the only way to effectively manage data. Anything that could not fit into a tightly organized structure would have to be stored on paper in a filing cabinet. 104 Hence, structured data is often not only human, but also machine readable.
Unstructured Data: Unstructured data refers to information that does not reside in a traditional row-column database. Unstructured data files often include text and multimedia content. Examples include e-mail messages, word processing documents, videos, photos, audio files, presentations, webpages, and many other kinds of documents.
Note that while these sorts of files may have an internal structure, they are still considered “unstructured” because the data they contain does not fit neatly in a database. Experts estimate that 80 to 90% of the data in any organization is unstructured. And the amount of unstructured data in enterprises is growing significantly—often many times faster than structured databases are growing.
Artificial intelligence tools and capabilities are increasingly being used to parse unstructured data and derive helpful context and insights. 105
4.3. Relevant Standards and Vocabularies
Vocabulary standards are playing a key force in enabling interoperability of patient data. Meaningful use may be accomplishing what has not happened before—a set of rules everyone will follow to allow patient data to flow between EHR systems, delivery networks, and regional organizations.
Whether the vocabulary standard is a classification system, terminology, controlled vocabulary, or nomenclature, a terminology server can provide a range of services to use and manage these complex entities. 106
To achieve interoperability within and across disparate healthcare IT systems, both free text and structured clinical information need to be synchronized across various applications. A terminology platform delivers a set of services and functions to map, manage, mediate, and manipulate terminologies for use and re-use in clinical applications.
To achieve interoperability within and across disparate healthcare IT systems, both free text and structured clinical information need to be synchronized.
A terminology platform supports sharing within as well as across applications. A terminology platform can map
- Between standard vocabularies,
- Between locally created content and standard vocabularies, and
- Between sets of locally created content.
This mapping supports standardized descriptions of clinical findings, patient observations, diagnoses, and interventions, allowing consistently entered information across care settings and by care providers. The EHR benefits by having a terminology platform that can ensure valid coded terms have been used. Currently, health information technology (health IT) systems in use support a limited number of vocabularies, including SNOMED-CT, LOINC, and RxNorm.
The HL7 Consolidated Clinical Document Architecture C-CDA R2.x includes a set of section and entry level templates to support the exchange of Care Plan CDA documents, including implementation of Case Management/Disease Management Care Plan CDA illustrated in this webpage.
4.4. Health Information Exchange Intermediaries
Today we see many third-party system integrators and middle-ware developers that have built bridges between systems to support information exchange. Many HIE entities work with such third-party vendors as well. Make sure your HIE works with your EHR vendor, and your partners’ EHR vendor(s), either directly or through a third-party intermediary.
4.5. Data/Information Repositories
An information repository is a collection of interrelated information maintained across a network on multiple servers. It creates a unified resource for anyone connected with the system to access when he or she needs information.
Numerous organizations use information repositories to handle their data and may network with others to share material as necessary. The underlying information technology needs to be very robust to handle the volume of information and frequency of requests. The term “information repository” can also refer to a specific kind of data management.
The information repository deposits relevant data along with meta-information on a regular basis. Users can run a query to find material relevant to their interests. Repositories may include a variety of types of information, including images, video, and text. Users may be able to narrow searches by type to find specific materials. Passwords and other security measures often limit access to protect the information’s integrity and limit abuses of the system. 108
4.6. APIs
An application program interface (API) is code that allows two software programs to communicate with each other. The API defines the correct way for a developer to write a program that requests services from an operating system (OS) or another application. APIs are implemented by function. The documentation of the application being called usually describes the required syntax.
Typically, APIs are released for third-party development as part of a software development kit (SDK) or as an open API published on the Internet. If the applications are written in different languages or have been written for different platforms, middleware can provide messaging services so that the two applications can communicate with each other. 109
Today, many APIs are developed to improve interoperability and facilitate interfacing, data integration, and information exchange among information systems, including health information technology (health IT) systems.
Digitizing, combining, and effectively using big data can give health care organizations significant benefits.
5. Potential Uses and Benefits of Data Analytics Technologies
5.1. Improved Health Outcomes
By digitizing, combining, and effectively using big data, health care organizations ranging from single-physician offices and multi-provider groups to large hospital networks and accountable care organizations stand to realize significant benefits.
Potential benefits include detecting diseases at earlier stages when they can be treated more easily and effectively, managing specific individual and population health, and detecting healthcare fraud more quickly and efficiently.
Big data analytics can address numerous questions. Certain developments or outcomes may be predicted and/or estimated based on vast amounts of historical data, such as the following:
Length of stay (LOS).
- Patients who will choose elective surgery.
- Patients who likely will not benefit from surgery.
- Complications.
- Patients at risk for medical complications.
- Patients at risk for sepsis, MRSA, C. difficile, or other hospital-acquired illness.
- Illness/disease progression.
- Patients at risk for advancement in disease states.
- Causal factors of illness/disease progression.
- Possible co-morbid conditions 110.
5.2. Mitigate Risk
Risks are everywhere in business. They include customer or employee theft, uncollected receivables, employee safety, and legal liability. Data analytics can help an organization understand risks and take preventive measures.
For instance, a retail chain could run a propensity model—a statistical model that can predict future actions or events—to determine which stores are at the highest risk for theft. The business could then use this data to determine the amount of security needed at the stores, or even whether it should divest from any locations.
Businesses can also use data analytics to limit losses after a setback occurs.
Businesses can also use data analytics to limit losses after a setback occurs. If a business overestimates demand for a product, it can use data analytics to determine the optimal price for a clearance sale to reduce inventory. An enterprise can even create statistical models to automatically make recommendations on how to resolve recurrent problems. 111
5.3. Optimize Reimbursement
A 600+ bed hospital system used data to determine that it had a significant amount of denials related to untimely filing of claims. By analyzing the data, the system identified and fixed a flaw in how its health care information systems were submitting claims. The value of the provider’s future write-off savings has been estimated at approximately $2 million.
A smaller facility in the western U.S. was experiencing costly delays in claims. Data revealed problems with physician documentation. Using the data as a guide, the hospital and physicians agreed to a new policy that included a penalty for non-compliance. Within three months, the hospital reduced the number of days between discharge and getting the claim into the claim management system from 26 to 13 days, which helped its cash flow.
The last example is a mid-sized hospital that experienced skyrocketing claims errors. It analyzed revenue cycle data to isolate major gaps in the claims transmission process and common errors in claims submitted from its health information system. Over the next three months, the hospital was able to cut the error rate from 20 percent to less than 10 percent. 112
5.4. Reduce Hospitalizations
The Emergency Department at Chicago’s Northshore University Health System is using data and analytics to assess patients suffering chest pain, to help determine who needs to be admitted for observation and who can be sent home safely.
Some of the benefits of this approach are shorter wait times, more free beds for those who really need them, lower costs, and more efficient use of staff time. According to CIO, “NorthShore CIO Steve Smith says it has reduced the Chest Pain Observation Days rate by 10 percent without increasing the rate of ED returns, mortality, or morbidity.” 113
5.5. Benchmarking/Referrals
In today’s competitive marketplace, seeing how your communities stack up against others allows you to quickly and accurately identify strengths and opportunities for change. It can also help you find target marketing, scaling efforts, and referral opportunities.
Typical benchmarking involves an aggregated summary to help you compare a business against other businesses within the same industry, for example. While this high-level benchmarking still has its place, it is becoming less impactful for businesses that are truly transforming into leading with experiences.
What matters now is not competing with the industry. It is competing on customer focus at every stage of the customer journey. A Walker report predicted that by 2020 customer experience would overtake price and product as the key brand differentiator. 114
Organizations can improve operational efficiency through data analytics.
5.6. Enhance Efficiencies
Organizations can improve operational efficiency through data analytics. Gathering and analyzing data about the supply chain can show where production delays or bottlenecks originate and help predict where future problems may arise. If a demand forecast shows that a specific vendor will not be able to handle the volume required for the holiday season, an enterprise could supplement or replace this vendor to avoid production delays.
In addition, many businesses—particularly in retail—struggle to optimize their inventory levels. Data analytics can help determine optimal supply for all of an enterprise’s products based on factors such as seasonality, holidays, and secular trends. 115
5.7. Improved Financial Health
Consulting firm McKinsey & Company estimates that big data analytics can enable more than $300 billion in savings per year in U.S. health care, with two-thirds of those savings through reductions of approximately 8% in national health care expenditures.
Clinical operations and research and development (R&D) are two of the largest areas for potential savings, with $165 billion and $108 billion in waste, respectively. McKinsey believes big data could help reduce waste and inefficiency in these areas:
- Clinical Operations: Comparative effectiveness research to determine more clinically relevant and cost-effective ways to diagnose and treat patients.
- Research & Development:
- Predictive modeling to lower attrition and produce a leaner, faster, more targeted R&D pipeline in drugs and devices.
- Statistical tools and algorithms to improve clinical trial design and patient recruitment to better match treatments to individual patients, thus reducing trial failures and speeding new treatments to market.
- Analyzing clinical trials and patient records to identify follow-on indications and discover adverse effects before products reach the market.
- Public Health:
- Analyzing disease patterns and tracking disease outbreaks and transmission to improve public health surveillance and speed response.
- Faster development of more accurately targeted vaccines, such as choosing the annual influenza strains.
- Turning large amounts of data into actionable information that can be used to identify needs, provide services, and predict and prevent crises, especially for the benefit of populations. 116
5.8. Improved Patient/ Resident/ Client Experience
Businesses collect customer data from many different channels, including physical retail, e-commerce, and social media. By using data analytics to create comprehensive customer profiles from this data, businesses can gain insights into customer behavior to provide a more personalized experience.
Organizations can run behavioral analytics models on customer data to optimize the customer experience.
Take a retail clothing business that has an online and physical presence. The company could analyze its sales data together with data from its social media pages and then create targeted social media campaigns to promote their e-commerce sales for product categories that already interest customers.
Organizations can run behavioral analytics models on customer data to optimize the customer experience further. For example, a business could run a predictive model on e-commerce transaction data to determine products to recommend at checkout to increase sales. 117
5.9. Improved Clinician/ Caregiver/ Staff Satisfaction (Physician/ Nurse)
If health systems want to improve the patient experience, they need to put the patients first and at the center of everything they do. The “soft stuff” counts to patients. Patients will continue to gauge their quality of care on their own proxy measures, like being treated respectfully, because that is what they understand. Hospital leaders may believe that patients are more concerned about issues like long wait times, but the data shows otherwise.
To really become transformational and succeed in the value-based care environment, hospitals and senior living need to understand their patients’ needs. Even though we cannot fix every little problem, we can zero in on the things that matter. And the only way to know how to zero in what matters is by looking at the data. 118 The following summary of research from Cleveland Clinic evaluates what factors are most important to patients:
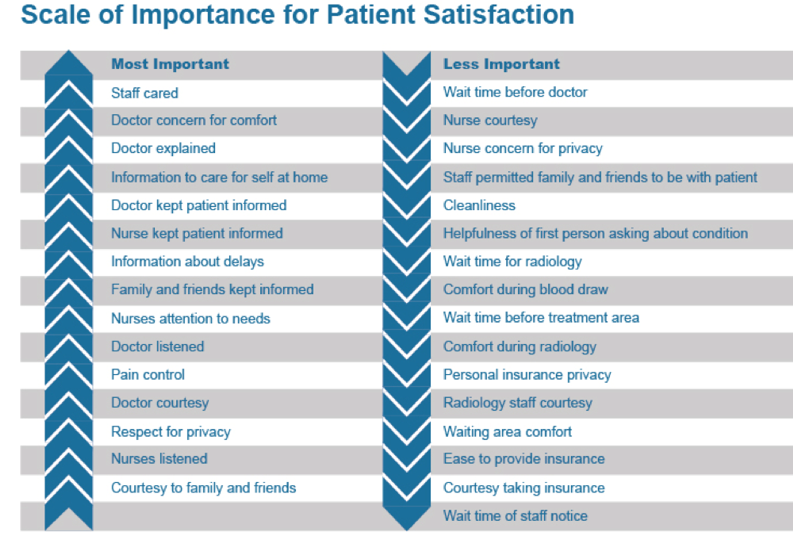
5.10. Enhanced Business Acumen and Strategic Positioning
For all the reasons listed above, data analytics enhances your business acumen and strategic positioning. Without the data and insight from the data, it will be difficult to achieve these benefits.
6. Potential LTPAC Provider Business Models
6.1. Value-Based Care
The Affordable Care Act (ACA) is shifting the health care system in the U.S. away from the traditional fee-for-service to a pay-for-performance system. Moreover, the Centers for Medicare & Medicaid Services (CMS) is moving to reimburse Medicare Certified Home Health on a value-based purchasing model instead of a prospective payment model. This shift is starting to eliminate the misalignment of incentives in traditional Medicare, Medicaid, and private insurance programs.
Many provisions and models in the ACA would benefit from care planning and coordination technologies and services, as well as encourage their adoption.
There are many provisions and models in the ACA that would benefit from care planning and coordination technologies and services, as well as encourage their adoption. The act created the Center for Medicare & Medicaid Innovation (CMMI), which explores new care delivery and payment models and initiatives that do the following:
- Use more holistic, patient-centered, and team-based approaches to chronic disease management and transitional care.
- Improve communication and care coordination among care providers.
- Improve care quality and population health while reducing growth in expenditures.
The act puts explicit emphasis on the use of health IT. It focuses on care planning and coordination technologies, health IT in health homes for enrollees with chronic conditions, the Independence at Home Demonstration, and the use of technology in new state options for long-term services and supports.
These initiatives include the following:
- Hospital Readmission Reduction Program (HRRP).
- Accountable care organizations (ACO).
- Bundled Payments for Care Improvement models, of which Retrospective Acute Hospital Stay and Post-Acute Service are relevant to long-term and post-acute care (LTPAC) providers.
LTPAC providers bring a significant value for hospitals, physician groups, payers, and ACO partners by providing the following services:
- Rehabilitation and skilled nursing facilities provide post-discharge/ post-acute patient rehabilitation.
- Skilled nursing facilities, assisted living facilities, continuing care retirement communities, housing with services, and home health agencies provide post-acute patient stabilization and sub-acute chronic disease management.
- LTPAC provides holistic person-centered care, including support services.
- LTPAC offers lower-cost care settings than hospitals.
These new care delivery and payment models will enable LTPAC providers who use technologies, like data analytic technologies, to derive revenue sources from strategic partners. The following white paper, “The importance of home and community-based settings in population health management,” offers some key questions LTPAC providers should discuss with their acute care partners.
6.2. Standard of Business
LTPAC and community health providers, special population agencies, self-pay and self-insured organizations, and others, especially not-for-profits, may offer an array of data analytic technologies and services.
Grants may cover these services. Or the organization may absorb the cost, with different revenue sources covering it, including charitable contributions.
6.3. Return on Investment (ROI) of Data Analytics Technologies

Return on investment (ROI) represents the ratio of the net gains relative to the initial investment over a certain period of time. Subsequently, ROI can be expressed in the following equation:
As discussed above, data analytic technologies deliver various benefits, including potential financial gains or savings, to different stakeholders. Stakeholders include patients and/or their families, payers, care providers, etc.
However, the financial gains or savings and ROI depend on a number of factors, including the care/ service delivery model, the payment/ reimbursement model, the technology, and of course costs.
The first and most important step in calculating ROI is to consider the different stakeholders, identify the investors, and calculate the gains and savings netted/accrued to each investing stakeholder under each particular care delivery and payment model. However, the following information will focus on the ROI of data analytic tools to the care provider, who usually invests in the data infrastructure, and data analytic capabilities and tools.
6.4. ROI to Care Provider
ROI to care providers can be calculated as follows:

The care provider who makes investments in information and communications technology infrastructure, data systems, and data analytics tools may reap the following benefits:
- Lower costs in delivering the same services, including staff efficiencies and staff travel costs.
- Higher reimbursements/payment from the payer or strategic partner in terms of incentive payments for avoiding more costly care settings, procedures, events, or penalties.
- Higher revenues from more patient volumes through more referral partners.
7. Planning for and Selecting Appropriate Data Analytic Technology
7.1. Planning for Data Analytics Solutions
Organizations should plan to invest in and leverage data analytics capabilities as part of their strategic planning and strategic IT planning efforts.
Organizations should plan to invest in and leverage data analytics capabilities as part of their strategic planning and strategic IT planning efforts.
A multidisciplinary team that includes management, clinicians, IT, and departments that would contribute or use any of the exchanged data should do the planning. Sometimes teams would include the technology vendors—for example, electronic health record (EHR), care planning and coordination software, telehealth, and data analytics vendors—and any third-party system integrators or facilitators the organization may need. Representatives of partner organizations with whom the organization will exchange information should also be included.
7.2. Visioning and Strategic Planning
Start the journey with the organization’s strategic plan as a guide. Some of your organization’s strategic goals would dictate a number of things that can help you plan for your data analytics program. These may include the following:
- Specific programs to serve certain populations, where they live, and who provides them with health care and support services.
- Strategic partners key to success and their area of service.
- Partners’ adopted health IT technologies (EHR, referral management, or care planning and coordination platforms), their interoperability and health information exchange (HIE) participation and capabilities.
- The specific data they need from your organization and the data you need from them. Your adopted health IT technologies (EHR, referral management, or care planning and coordination platforms) and their interoperability and health information exchange (HIE) capabilities.
You may need to work with middleware developers and integration engine/system integration third parties, and you may need to participate in building robust capabilities in data analytics.
It is best to partner during strategic planning and for all your strategic goals. Remember, given the current state of interoperability, you may need to work with middleware developers and integration engine/system integration third parties, and you may need to participate in more than one data analytics platform. This scenario is definitely true for multi-state multi-site organizations, but it is sometimes true for single sites with different programs, partners, and HIE needs.
7.3. Organizational Readiness Assessment
7.3.1. Available Technology Solutions
Different data analytic platforms are available for specific application areas. You will likely need multiple data analytic platforms to address all your specific analytic needs. Use the LeadingAge CAST Data Analytics Online Selection Tool to make a short list of vendors. Remember to consider not only the technology solutions, but also areas of consulting and additional services you may need your vendor partner to support.
7.3.2. Available Data
Review the available data from your organization. Consider the information you would like to capture from outside parties, such as engaging with an HIE entity and data clearinghouses. Make sure it is semantically interoperable and has the same meaning as the HIE’s system.
7.3.3. Additional Data Needed and Sources
Think about the data your organization would like to start receiving as you connect to an additional source, such as an HIE. You can exchange many different types of data with an HIE, and many types are real-time. Exchanging this data can have significant implications for your organization and can change your workflows drastically.
An example is admission notification of a patient or client you have just discharged. Consider how you can take advantage of these new data elements not only to improve your care quality and outcomes, but also to redesign your workflows to maximize efficiencies and bottom line.
Many people believe interoperability means every product works with others seamlessly, but not even the most highly integrated suite of components in a product fully does so.
7.3.4. Interoperability/ Interfacing Capability
Interoperability means that two disparate systems are able to communicate with one another to exchange data. To end users and many in the industry, interoperability means every product works with others seamlessly. Unfortunately, not even the most highly integrated suite of components in a product fully does so.
When modules or components are integrated, they generally have been built by the same group that did the original development and programming, have similar design characteristics, and can exchange most data. In general, the components or modules in highly integrated suites of products work well together, but they will not work with any other vendor’s product without specialized interfacing.
Recently we have seen unprecedented efforts to develop, implement, and use interoperability standards and standard data elements in EHRs to support interoperability. Many EHR vendors have created APIs to get data out of systems and support interoperability, interfacing, and information exchange between systems and providers.
In addition, today we see many third-party system integrators and middleware developers that have built bridges between systems to support information exchange. Many HIE entities work with such third-party vendors as well. Make sure your HIE works with your EHR vendor, and your partners’ EHR vendor(s), either directly or through a third-party intermediary.
You may want to consider setting up an enterprise-wide data warehouse to store data from all your different systems and sources, and design your data analytics initiative to sit on top of the data warehouse. This approach is especially helpful when working with multiple data and software systems and when the vendor is not able to interface with the others.
7.3.5. Staff Competencies and Availability
The staff’s technical aptitude should be a factor in selecting a data analytics platform for a community, but it should not be a driving one. Ease of use should be considered regardless of the staff’s skill level. No technology should compete for the time staff should be dedicating to residents. Ongoing training should always be a part of the overall plan to support any technology, but especially one that impacts life safety and security.
7.3.6. Data Partner Assessment
Selecting a data partner dedicated to analytics is the first step. There are a lot of technology “vendors.” Choose a partner instead. Good partnership requires deep resources to create a positive experience for all aspects of an organization. Select a partner with these characteristics:
- Dedicated to innovation and a convergence strategy.
- Can assist in evaluating workflow and processes.
- Can deliver not only the technology solution(s) but also can fill any gaps in your internal staff’s competencies and resources with additional services.
- Offers additional services such as data migration/ integration, data cleansing, data audit, etc. and domain specific consulting expertise such as cost-accounting, quality improvement, etc.These additional services could be key to the overall success.
There are a lot of technology “vendors.” Choose a partner instead.
According to a provider in the technology field addressing the future of senior living, “While investing in new and advanced forms of technology for senior living facilities can be expensive and time consuming, it is critical to staying relevant in the industry and meeting the growing demand of residents. As communities look at new projects or go through re-financing on existing communities, it is important to engage technology experts and include forward-thinking solutions in the budget planning process.” 119
7.3.7. IT Infrastructure
A comprehensive inventory of IT infrastructure components is critical to developing a technology plan. Knowing the current state of technology today will ensure that its configuration and scalability will sustain the organization into the future. Ensure your IT infrastructure has redundancies built in, both in architecture and in having dual internet service providers to ensure that your organization can connect to a data analytics platform.
7.3.8. Operating Environment (including Applicable Federal and State Regulations)
The operating environment includes the care setting, the state in which the community is located, the applicable federal and state regulations, application vendors, and care and data partners.
7.4. Operational Planning
7.4.1. Project Team
Operations team members will play a key role in implementation success, as they are the most connected to the people they serve. Ensure that operational leadership has buy-in early, and work alongside of these leaders to identify the best individuals in the field to become evangelists. The key to success is engaging field operations in the initiative’s goals—such as medical and nursing directors, quality directors/managers, and accountants, in addition to the administrators and C-suite officers.
7.4.2. Goal Setting
Defining both the immediate and potential future goals of your data analytics initiative is critical to measuring success. Each organization will have different ideas of what success looks like based on strategic goals and internal operations. Before starting a data analytics program, the organization should set a clear series of goals and metrics.
Keep in mind that goals should be measurable and routinely reported on within the organization’s operations. Ensure that they are SMART goals:
- Specific.
- Measurable.
- Attainable.
- Realistic.
- Trackable.
Setting both short-term and long-term goals for the data analytics program is highly recommended. The program will naturally change and progress over time. Organizational goals set at the program’s start will likely be different six to 12 months post implementation.
The goals should be evaluated continuously and updated as programs change. However, setting ambitious long-term goals from the start helps you design and build the architecture of your data warehouse and infrastructure. This long-term planning will give you the ability to achieve your short-term goals, with little to no major changes to your data infrastructure investment as you progress towards your long-term goals.
Before starting any program, clearly define the new model of care and prepare staff with training and support plans.
7.4.3. Program Design
Data analytic programs should be designed with the organization’s short- and long-term goals in mind to help ensure success. Each program’s design should always consider how to align objectives, strategies, and technical plans by using the data infrastructure. Be sure to share experiences from other similar organizations to assist in strategies to build a data analytics program within the organization or strengthen an existing one.
7.4.4. Technology Review and Selection
Once an organization has completed the visioning and strategic planning exercise, assessed organizational readiness, assembled the project team, set the project’s goals, and designed the program, then the team needs to develop a set of detailed technology requirements. These criteria will be used to review and select the appropriate data analytics solutions.
Setting and Focus
The planning process would help identify key requirements that should include the following:
The business line(s) where the organization wants to deploy the data analytics solution; this should be the primary setting for the targeted population (home health, skilled nursing facility, housing with services, etc.).
System Types
The planning team should also consider the analytic system types, which include one or more of the following:
- Descriptive Analytics
- Diagnostic Analytics
- Predictive Analytics
- Prescriptive Analytics
Application Areas
The planning team should also consider the application areas, which include one or more of the following:
- Financial
- Clinical
- Referral
- HR
- Quality Rating (such as Five-Star Quality Rating)
- Business
- Population Health
- Risk Management
- Value-Based Care
Core Services
The planning team should also consider the core services, which include one or more of the following:
- Data Visualization
- Modeling/Model Building
- Learning Capabilities
- Decision Support
- Dashboards
- Benchmarking/ Scorecard Across Sites/Providers/Markets
The planning team should consider the data management and engineering services, which include one or more of the following:
- Data Cleansing
- Integrity Audits
- Data Migration/Integration
- Data Consolidation
- Warehousing/Clearinghouse
- Application Program Interface (API) Development
Additional Services and Consulting
The planning team should consider the additional services and consulting, which include one or more of the following:
- Population Health Management
- Disease Management (including Chronic Disease Management)
- Quality Management (including Five-Star Quality Rating)
- Financial Management
- Cost Accounting
- Risk Management
- Business Intelligence
- Marketing/Communication
- HR Management including Time and Attendance Tracking
- PBJ Reporting
Information, Interfacing, and Integration
The planning team should consider the source of information, which includes one or more of the following:
- EHRs (including Long-Term Services and Supports (LTSS) and Pharmacy EHRs)
- Financial Systems
- Referral Systems
- Telehealth and Remote Patient Monitoring (RPM) Technologies
- Medication Management Technologies
- Functional Assessment and Activity Monitoring Technologies
- Wellness Systems
- HR Systems
- Laboratory Systems
- Marketing Systems
- CRM Systems
- Engagement Systems
- Public Health Data
- HIE/Health Registry Data
- Regulatory Assessments Data (such as OASIS, MDS)
- Public Reporting, including Quality Data
- Patient Generated Data
- Social Determinants of Health Data (SDOH)
- Claims Data
Program Support Services
The support services that vendors may offer include the following:
- Analytic Program Development (Customization, Planning, Design, Select Input Data, Type of Analytics, Decision Support, etc.)
- Staff Training
- Staff Education
- Staff Engagement Services
Hardware and Software Requirements
Finally, hardware/software requirements that could guide the selection process include how software is offered:
Local Model, which means that it needs to be installed on servers local to the care provider.
Third-Party Hosted Model/Software as a Service Model (SaaS), where the software is hosted somewhere else and the provider pays licensing and hosting fees or pays for usage, as opposed to maintaining local servers’ infrastructure.
Other important hardware and software requirements include remote access functionality support, offline functionality support when running third-party hosted or SaaS software, and mobile device support, such as for smartphones and tablets.
7.4.5. Implementation
The implementation and planning phase takes the information gained by the assessment phase and begins to answer the “who,” “how,” and “when” questions. During this phase, identify executive steering committee members and create a project charter. Set aside enough time for this phase, as it is involved and detailed.
Contingency planning is part of the overall plan; the team must assess and identify potential risks throughout the project and deal with them quickly. Most often, risk is not going to severely impact the project. However, when a risk that could impact the project’s timeline, budget, or goals appears, the steering committee should be made aware to make decisions.
Contingency planning is part of the overall plan; the team must assess and identify potential risks throughout the project and deal with them quickly.
7.4.6. Post-Implementation Monitoring
It is important to provide continuous monitoring of any program. Monitoring validates the program, tracks improvement, and identifies any new problems that may occur. Measuring the program’s quality will provide an opportunity to establish its positive impact on the organization, consumers, and any partners. If post-monitoring does not show significant differences in care planning and coordination for the people served, the organization will need to rethink the program.
8. Data Analytics Matrix Components
The Data Analytics Selection Matrix has 14 sections to help organizations narrow the possible products:
- Biz Line-Care Applicability
- Type-Application Area
- Core Services
- Additional Services Consulting
- Sources of Information
- Program Development
- Hardware-Software Front End
- Reports
- Program Support
- Interoperability
- Tech Supportability
- Legal-Regulatory
- Company’s Experience
- Strengths+
The Data Analytics Matrix includes the following sections:
Business Line/Care Applicability
Business line/care applicability illustrates the various business lines to which the safety technology product is applicable, including the following:
Acute Care Settings (Physicians’ Offices, Emergency Department, Hospitals, Attending LTPAC Physician).
LTPAC and Other Settings (Home Health/Home Care, Hospice, Housing with Services, Community-Based Programs, Adult Day Care/Senior Centers, Assisted Living Facilities, Acute Rehab Facilities, Long-Term Acute Care Hospitals, Long-Term Care Rehab Facilities, Skilled Nursing Facilities, Intermediate Care Facilities, Intellectual Disabilities/Mental Retardation/Developmental Disabilities (ID/MR/DD) Facilities, Life Plan Community (Formerly CCRC), Program of All-Inclusive Care for the Elderly (PACE), Accountable Care Organizations (ACO)/Integrated Delivery Networks (IDN), Multiple Site Integration).
Type-Application Area
This category includes options for the following:
Application Type:
- Descriptive Analytics
- Diagnostic Analytics
- Predictive Analytics
- Prescriptive Analytics
Application Area:
- Financial
- Clinical
- Referral
- HR
- Quality (such as Five-Star Quality Rating)
- Business
- Population Health
- Risk Management
- Value-Based Care
- Other (Please List)
Core Services
This category includes options for the following:
Data Management and Engineering:
- Data Cleansing
- Integrity Audits
- Migration/Integration
- Consolidation
- Warehousing/Clearinghouse
- Application Program Interface (API) Development
Core Data Analytic Services:
- Data Visualization
- Data Exploration
- Modeling/Model Building
- Learning Capabilities
- Decision Support
- Dashboards
- Benchmarking/ Scorecard Across Sites/Providers/Markets
- Other Data Analytic Services (Please List)
Additional Services and Consulting
This category includes options for the following:
- Population Health Management
- Disease Management (including Chronic Disease Management)
- Quality Management (including Five-Star Quality Rating)
- Financial Management
- Cost Accounting
- Risk Management
- Business Intelligence
- Marketing/Communication
- HR Management including Time and Attendance Tracking
- PBJ Reporting
- Other Consulting Services (Please List)
Sources of Information, Interfacing, and Integration
This category includes options for the following:
- EHRs (including LTSS and Pharmacy EHRs)
- Financial System Data
- Referral Systems
- Telehealth and Remote Patient Monitoring (RPM) Technologies
- Medication Management Technologies
- Functional Assessment and Activity Monitoring Technologies
- Wellness Systems
- HR Systems
- Laboratory Data
- Marketing Data
- CRM Data
- Engagement Data
- Public Health Data
- HIE/Health Registry Data
- Regulatory Assessments (such as OASIS, MDS)
- Public Reporting including Quality Data (Yes; Public, Yes; Private, Yes; Propriety; Yes; Multiple, No)
- Patient-Generated Data
- Social Determinants of Health Data (SDOH)
- Claims Data (Yes; Public, Yes; Private, Yes; Both, No)
- Other (Please List)
Program Development
This category includes options for the following:
- Analytic Program Development (Customization, Planning, Design, Select Input Data, Type of Analytics, Decision Support, etc.)
- Staff Training
- Staff Education
- Staff Engagement Services
- Other (Please List)
Hardware and Software Requirements – Front End
This category includes options for the following:
- Minimum Processor Speed, Hard Drive Storage, RAM requirements, if any applicable
- Operating System (OS) – Windows
- Operating System (OS) – Apple
- Operating System (OS) – Unix/Linux
- Network Specifications
- Wireless Specifications
- Supported by Modern Browsers (CSS3/HTML5)
- Minimum Internet/Bandwidth Specifications
- Miscellaneous Software/Applets Needed (such as Citrix)
- Miscellaneous Reporting Specifications (such as Crystal Reports)
- Scalability
- Local Model
- 3rd-Party Hosted Model
- Software as a Service Model (SaaS)
- Remote Access
- Off-Line Functionality Support
- Ability to Store/Handle Attachments (Insurance Card, Historical Notes, etc.)
- Available for Purchase
- Available for Lease
- Cellular Carriers that Support Solution (Please List)
- Mobile OS – Android
- Mobile OS – Blackberry
- Mobile OS – iOS
- OS – Unix/Linux
- Mobile OS – Windows
- Mobile-Optimized Interface (through Dedicated App. Mobile Optimized Web Pages)
Reports and Communication
This category includes options for the following:
- Customizable Reports to Different Stakeholders
- Customizable Alerts to Different Stakeholders
- Ability to Schedule Automatic Reports
Communication Modality:
- Alerts
- Messaging
- API
- Other (Please List)
Program Support
This category includes options for the following:
- IT/Network Troubleshooting & Support
- Front-End System Set-up
- Front-End System Customization
- Back-End System Set-up
- Back-End System Customization
- Onsite Staff Training
- Online Staff Training
- Other (Please List)
Interoperability, Interoperability Standards, and API
This category includes options for the following:
- Interoperability Supported (N=None, E= Export Data Only, I= Import Data Only, or B=Bi-Directional Data Import and Export)
- Interoperability Standards Supported (Please List)
- Application Program Interface (API) Available
- API Notes: Please List Available API
Technical Supportability
This category includes options for the following:
- Phone Support—No, Yes (Limited Hours), Yes (24 Hours)
- Web Support—No, Yes (Limited Hours), Yes (24 Hours)
- E-Mail Support
- Listserv and/or Usergroup
- Online Training
- Onsite Training
- Other (Please List)
Legal-Regulatory
This category includes options for the following:
- HITECH
- HIPAA
- Security – List HIPAA & HITECH Act Requirements Met
- List Applicable Regulatory Requirements Met
- Provide a Link to Company’s Cyberliability Policy
- List Any Other Legal Requirements
- Provide Link to Sample Contract
Company Experience
This category includes options for the following:
- Number of Years in Business
- Release Date of Current Version
- Number of Patients (Regardless of Setting)
- Core Customer Base, Focus of Line of Business
- Link/s to Additional Case Study/ies
Strengths, Areas for Improvement, Ongoing Development, and References
This category includes options for the following:
- Strengths
- Areas for Improvement
- Ongoing Development
- References
9. Contributors
9.1. Contributing Writers
Majd Alwan, Ph.D., LeadingAge CAST
Nadia Angelidou, PointRight
Scott Code, LeadingAge CAST
9.2. Workgroup Members
Lois Krotz, CFA, KLAS Research
Majd Alwan, Ph.D., LeadingAge CAST
Maria Arellano, PointRight
Nadia Angelidou, PointRight
Paul Hess, KLAS Research
Ryan Pretnik, KLAS Research
Scott Code, LeadingAge CAST
Sharon Fisher, PointRight
Timothy Thate, CPHIMS, PMP, CAE, LeadingAge NY
9.3. Participating Vendors
DashPoint Analytics
LeadingAge NY (Quality Apex)
PointRight
Trella Health
Yardi
10. References
1. https://www.lotame.com/what-is-data-analytics/
2. https://rtslabs.com/the-4-types-of-data-analytics-and-how-each-kind-can-help-you/
3. https://rtslabs.com/the-4-types-of-data-analytics-and-how-each-kind-can-help-you/
4. https://rtslabs.com/the-4-types-of-data-analytics-and-how-each-kind-can-help-you/
5. https://rtslabs.com/the-4-types-of-data-analytics-and-how-each-kind-can-help-you/
6. https://www.healthcatalyst.com/financial-data-in-health care-edw
7. https://leadingage.org/white-papers/electronic-health-records-ehrs-long-term-and-post-acute-care-primer-planning-and-vendor#2
8. https://leadingage.org/white-papers/electronic-health-records-ehrs-long-term-and-post-acute-care-primer-planning-and-vendor#2
9. https://www.cdc.gov/pophealthtraining/whatis.html
10. https://onlinepublichealth.gwu.edu/resources/what-is-population-health
11. https://www.healthcareitnews.com/news/population-health-analytics-combatting-challenges#:~:text=Population%20health%20analytics%20is%20being%20increasingly%20used%20as,care%20plans%2C%20performance%20benchmarking%2C%20planning%20interventions%20and%20
12. https://www.himss.org/resources/healthcare-crm-redefining-models-and-optimizing-relationships
13. https://www.datapine.com/blog/big-data-examples-in-healthcare/
14. https://getreferralmd.com/2015/02/reduce-leakage-increase-patient-referral-volume/
15. https://www.analyticsinhr.com/blog/what-is-hr-analytics/
16. https://www.hrtechnologist.com/articles/hr-analytics/what-is-hr-analytics/
17. https://www.chartattack.com/health care-analytics/
18. https://www.cms.gov/Medicare/Quality-Initiatives-Patient-Assessment-Instruments/QualityMeasures
19. https://www.nthrive.com/blog/value-based-care-analytics-leveraging-data-insights-to-enhance-reimbursement-and-quality
20. https://blog.definitivehc.com/real-world-data-value-based-care
21. https://catalyst.nejm.org/doi/full/10.1056/CAT.18.0197
22. https://www.mastersindatascience.org/resources/what-is-business-analytics/
23. https://www.ngdata.com/what-is-business-analytics/
24. https://www.himss.org/resources-all
25. https://www.leadingage.org/white-papers/electronic-health-records-ehrs-long-term-and-post-acute-care-primer-planning-and-vendor?_ga=2.213451793.486533141.1596641076-1282673316.1589284927#2.1
26. https://account.ache.org/iweb/upload/ReiterSong_Ch1-4e0b591e.pdf
27. https://study.com/academy/lesson/financial-management-in-health care-organizations-roles-functions.html
28. https://www.who.int/management/Referralnotes.doc
29. https://leadingage.org/white-papers/telehealth-and-remote-patient-monitoring-long-term-and-post-acute-care-primer-and
30. https://www.leadingage.org/white-papers/medication-management-technologies-long-term-and-post-acute-care-primer-and-provider#2
31. https://www.leadingage.org/white-papers/functional-assessment-and-activity-monitoring-technology-primer-and-provider-selection#3
32. https://www.leadingage.org/cast/resources/health-and-wellness-technologies
33. https://www.techopedia.com/definition/139/hr-management-system-hrms
34. https://www.ncbi.nlm.nih.gov/pmc/articles/PMC5391731/
35. https://elearningindustry.com/hr-software-essential-for-healthcare-sector
36. https://www.ascls.org/position-papers/177-value-of-clinical-laboratory-services/153-value-of-clinical-laboratory-services
37. https://www.allstarss.com/blog/inside-data-and-document-capture-in-health-care-marketing/
38. https://en.wikipedia.org/wiki/Healthcare_CRM
39. https://www.evariant.com/faq/what-is-a-healthcare-crm
40. https://www.healthcatalyst.com/insights/best-patient-engagement-strategies-use-quality-data
41. https://www.mass.gov/public-health-data-warehouse-phd
42. https://phpartners.org/pdf/StatsChapterPDF.pdf
43. https://en.wikipedia.org/wiki/Health_information_exchange
44. https://www.healthit.gov/topic/health-it-and-health-information-exchange-basics/what-hie
45. https://www.resdac.org/cms-data/files/oasis
46. https://pubmed.ncbi.nlm.nih.gov/23216513/
47. https://www.cms.gov/Research-Statistics-Data-and-Systems/Computer-Data-and-Systems/Minimum-Data-Set-3-0-Public-Reports
48. https://www.ncbi.nlm.nih.gov/pmc/articles/PMC4957420/#:~:text=Public%20reporting%20(PR)%20is%20a,on%20performance%20for%20which%20there
49. https://searchhealthit.techtarget.com/definition/patient-generated-health-data-PGHD
50. https://www.who.int/social_determinants/sdh_definition/en/
51. https://www.healthcatalyst.com/insights/social-determinants-health-todays-data-imperative
52. https://www.workplacetesting.com/definition/994/medical-claims-data
53. https://www.ama-assn.org/practice-management/medicare/medicare-claims-data-release
54. https://www.nlm.nih.gov/nichsr/stats_tutorial/section3/mod3_data.html
55. https://en.wikipedia.org/wiki/Data_cleansing
56. https://www.techopedia.com/definition/1174/data-cleansing
57. https://www.healthit.gov/playbook/pddq-framework/data-quality/data-cleansing-and-improvement/
58. https://digitalguardian.com/blog/what-data-integrity-data-protection-101
59. https://pointright.com/products/data-integrity-audit-dia/
60. https://www.healthit.gov/playbook/pddq-framework/data-quality/data-quality-assessment/
61. https://www.techopedia.com/definition/1180/data-migration
62. https://pediaa.com/what-is-the-difference-between-data-integration-and-data-migration/
63. https://www.techopedia.com/definition/28034/data-consolidation
64. https://link.springer.com/referenceworkentry/10.1007%2F978-3-319-17885-1_254
65. https://nearterm.com/what-is-a-healthcare-clearinghouse-medical-billing-electronic-claims/
66. https://en.wikipedia.org/wiki/API
67. https://www.mulesoft.com/resources/api/what-is-an-api
68. https://www.sciencedirect.com/topics/computer-science/data-exploration
69. https:/s/www.datasciencegraduateprograms.com/data-modeling/
70. https://www.northeastern.edu/graduate/blog/statistical-modeling-for-data-analysis/
71. James G, Witten D, Hastie T, Tibshirani R “An Introduction to Statistical Learning, With Applications in R” Springer Texts in Statistics
72. https://www.healthcatalyst.com/data-science-healthcare-what-leaders-must-know
73. https://www.techopedia.com/definition/770/decision-support-system-dss
74. https://www.healthit.gov/topic/safety/clinical-decision-support
75. https://www.dataplusscience.com/DashboardDefinition.html#:~:text=%E2%80%9CA%20dashboard%20is%20a%20visual%20display%20of%20data,it%E2%80%99s%20not%20possible%20to%20create%20a%20narrow%20
76. https://www.healthcatalyst.com/value-of-healthcare-dashboards
77. https://www.healthcatalyst.com/healthcare-dashboards-vs-scorecards-to-improve-outcomes
78. https://www.healthcatalyst.com/healthcare-dashboards-vs-scorecards-to-improve-outcomes
79. https://www.oberlo.com/ecommerce-wiki/benchmarking
80. https://getreferralmd.com/2015/02/reduce-leakage-increase-patient-referral-volume/
81. https://www.aha.org/center/population-health/population-health-management#:~:text=Population%20health%20management%20refers%20to,appropriate%20financial%20and%20care%20models
82. https://www.healthcatalyst.com/managing-diabetes-population-health-management
83. https://www.amcp.org/about/managed-care-pharmacy-101/concepts-managed-care-pharmacy/disease-management#:~:text=Disease%20management%20is%20a%20system,their%20disease%20and%20prevent%20complications
84. https://www.verywellhealth.com/disease-management-2615164
85. https://www.lark.com/blog/disease-management-programs/
86. https://smallbusiness.chron.com/quality-management-health-care-62136.html
87. https://www.tefen.com/insights/industries/Healthcare/quality_Management%20_in_healthcare
88. https://www.cms.gov/Medicare/Provider-Enrollment-and-Certification/CertificationandComplianc/FSQRS
89. https://study.com/academy/lesson/financial-management-in-healthcare-organizations-roles-functions.html
90. https://account.ache.org/iweb/upload/ReiterSong_Ch1-4e0b591e.pdf
91. https://smallbusiness.chron.com/role-financial-management-health-care-76263.html#:~:text=What%20Financial%20Management%20Means&text=or%20example%2C%20health%20care%20providers,both%20part%20of%20financial%20management
92. https://blog.gppcpa.com/blog/2018/03/06/7-tips-implementing-cost-accounting-health-care-settings
93. https://www.researchgate.net/publication/320303448_Cost_Accounting_for_Management_of_Health_Services_in_a_Hospital
94. https://catalyst.nejm.org/doi/full/10.1056/CAT.18.0197
95. https://www.investopedia.com/articles/personal-finance/072315/importance-healthcare-risk-management.asp#:~:text=Common%20financial%2Drelated%20risk%20management,points%20and%20reduce%20overall%20costs
96. https://elearning.scranton.edu/resource/business-leadership/purpose-of-risk-management-in-healthcare
97. https://www.izenda.com/health care-business-intelligence/
98. https://www.cdc.gov/healthcommunication/toolstemplates/Basics.html
99. https://mitrefinch.com/blog/employee-time-and-attendance-challenges-in-health-care-facilities/
100. https://mitrefinch.com/all-solutions/healthcare/
101. https://www.cms.gov/Medicare/Quality-Initiatives-Patient-Assessment-Instruments/NursingHomeQualityInits/Staffing-Data-Submission-PBJ
102. https://www.paycor.com/resource-center/payroll-based-journal-what-is-it
103. https://mitrefinch.com/blog/what-is-payroll-based-journal/
104. https://www.webopedia.com/TERM/S/structured_data.html
105. https://www.webopedia.com/TERM/U/unstructured_data.html
106. https://blog.healthlanguage.com/blog/bid/216980/How-a-Terminology-Server-Can-Support-an-EHR
107. https://blog.healthlanguage.com/blog/bid/216980/How-a-Terminology-Server-Can-Support-an-EHR
108. https://www.wisegeek.com/what-is-an-information-repository.htm
109. https://searchmicroservices.techtarget.com/definition/application-program-interface-API
110. https://www.ncbi.nlm.nih.gov/pmc/articles/PMC4341817/
111. https://www.stitchdata.com/resources/benefits-of-data-analytics/
112. https://www.beckershospitalreview.com/finance/how-hospitals-can-use-data-analytics-to-improve-rcm-performance-4-thoughts-from-change-healthcare-s-marcy-tatsch.html
113. https://www.healthstream.com/resources/blog/blog/2020/07/21/six-ways-healthcare-analytics-can-improve-patient-care
114. https://blog.adobe.com/en/publish/2017/12/13/data-analytics-benchmarks-making-sense-experience-business-data.html#gs.iw15ka
115. https://www.stitchdata.com/resources/benefits-of-data-analytics/
116. https://www.ncbi.nlm.nih.gov/pmc/articles/PMC4341817/
117. https://www.stitchdata.com/resources/benefits-of-data-analytics/
118. https://www.healthcatalyst.com/insights/patient-satisfaction-outcomes-data
119. https://its-networks.com/technology-and-the-future-of-senior-living/